There are many companies that manage an incredible numbers of wordpress installations for customers. So from now, you can offer their customers a nice WordPress statistics Grafana dashboard without sharing access details to WordPress admin panel.
Up to you if you want share WordPress statistics Grafana dashboard to you costumers for free or pay!
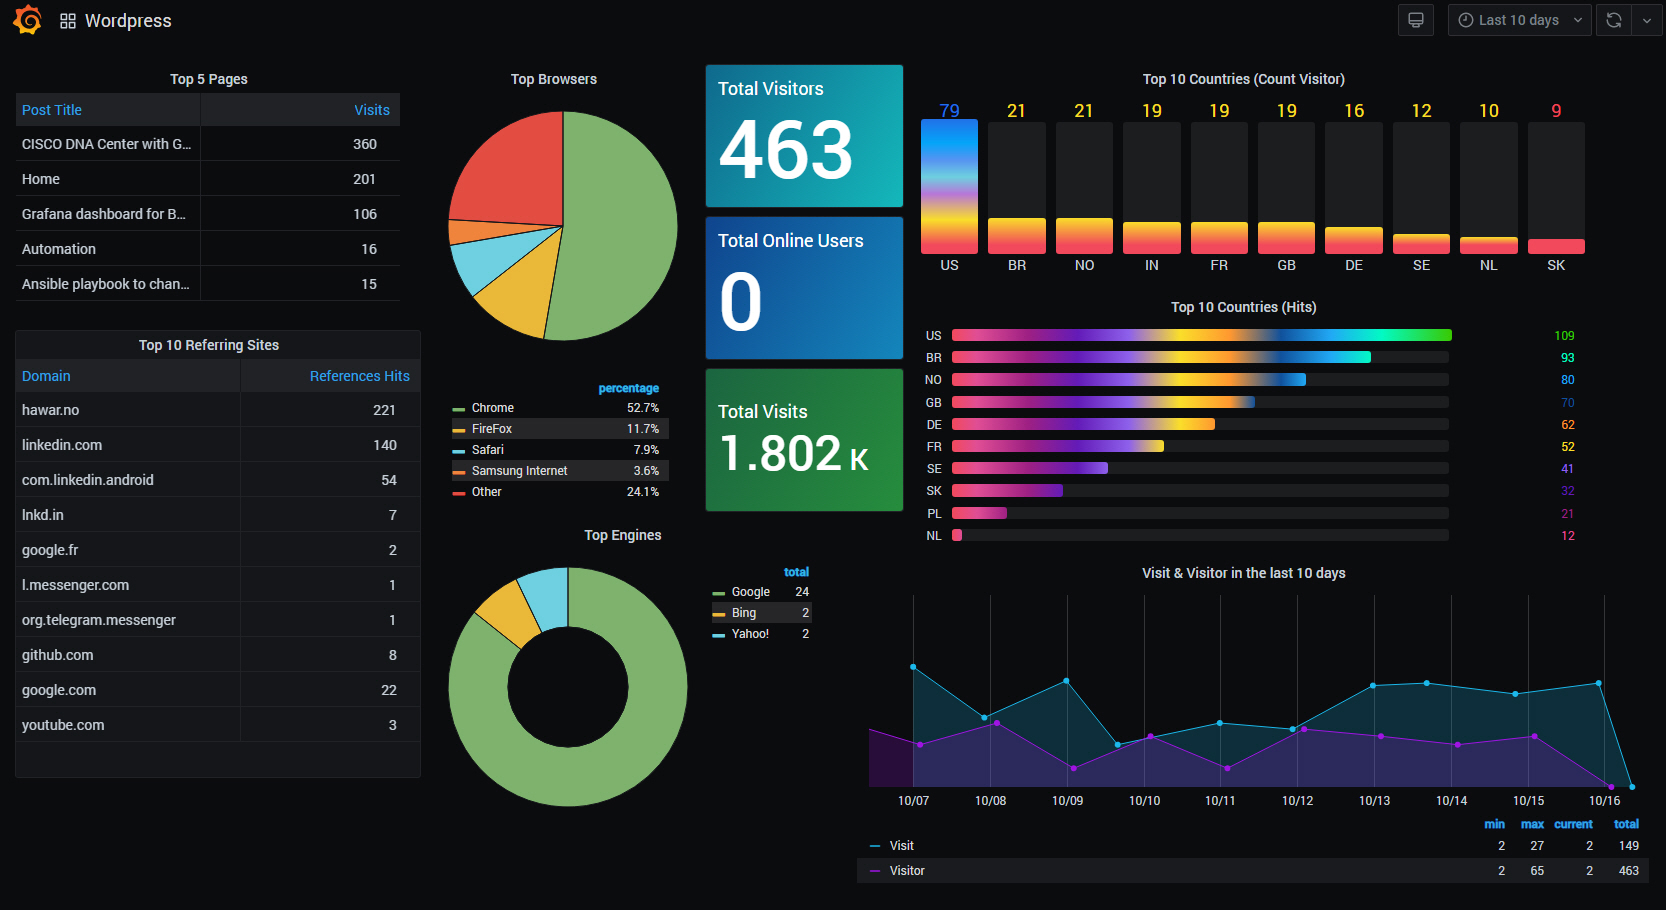
The following statistics are showing up on the Grafana dashboard:
- Top 5 pages
- Top browsers
- Top 10 Referring Sites
- Top Engines
- Top 10 Countries (Count Visitor)
- Top 10 Countries (Hits)
- Total Visitors
- Total Online Users
- Total Visits
- Visit & Visitor in the last 10 days
- Install “WP Statistics” plugin for WordPress as shown in the image below

- Activate wp-statistics plugin
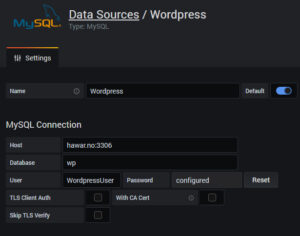
- Add WordPress Database details as MySQL datasource in Grafana to access “WP Statistics” data, as shown in the image below
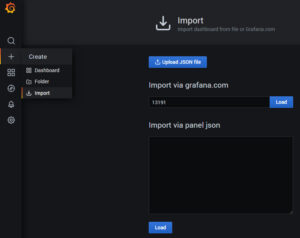
- Add my created Grafana dashboard ID (13191) into your Grafana Dashboard by using import function as shown in the image below
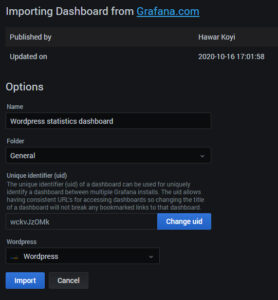
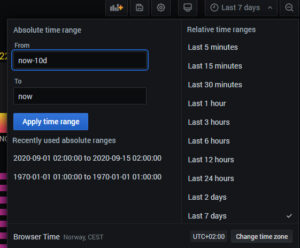
- After you have successfully added the dashboard, change time range to last 10-days as shown in the image below
Take a look on my preview video as shown in the video below, to show you how to add MySQL datasource and dashboard into Grafana,

