
UPDATED 21.04.2024
Monitor your power usage, costs and more in Grafana dashboard.
This solution is created in an advanced way but installing in easy way. You can install this dashboard for yourself or customers within 3-5 minutes.
Note: Automatic fetching and updating tomorrow’s power price panels from Nord Pool everyday at 13:00 CET.
Before starting, consider becoming a Tibber customer?
I would be happy if you use this referral code https://tibber.com/no/invite/gp15xttt. That will give each of us a bonus 500 kr. which can be used for smart equipment in Tibber store like Tibber Pulse.
Let’s getting started!
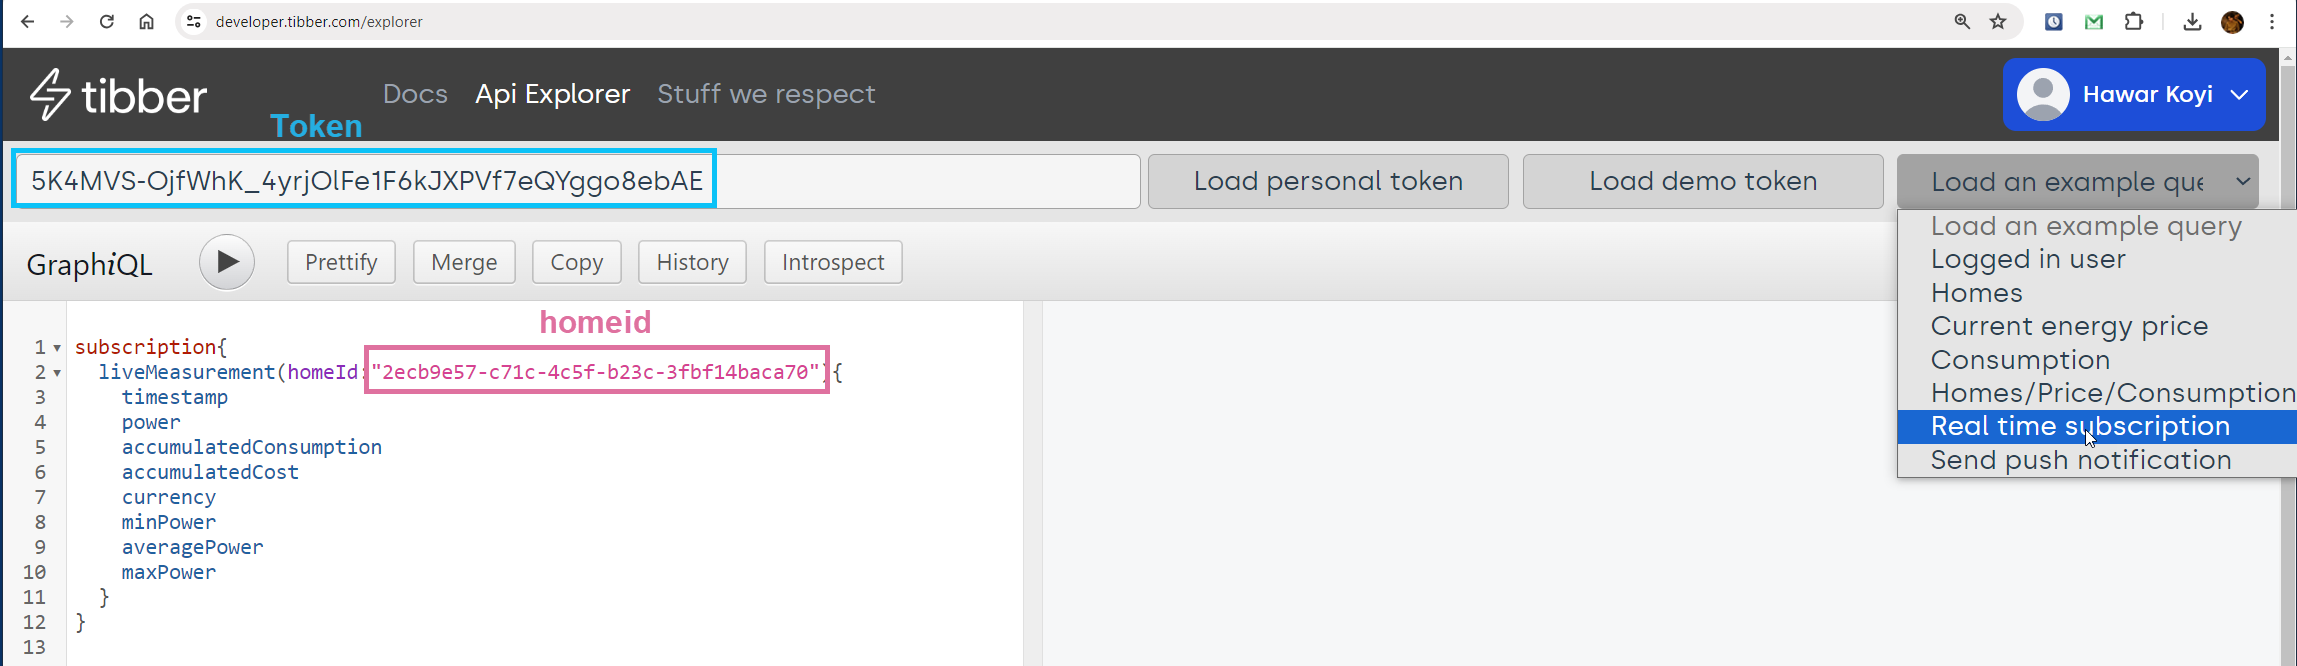
- Get your token and homeId form Tibber

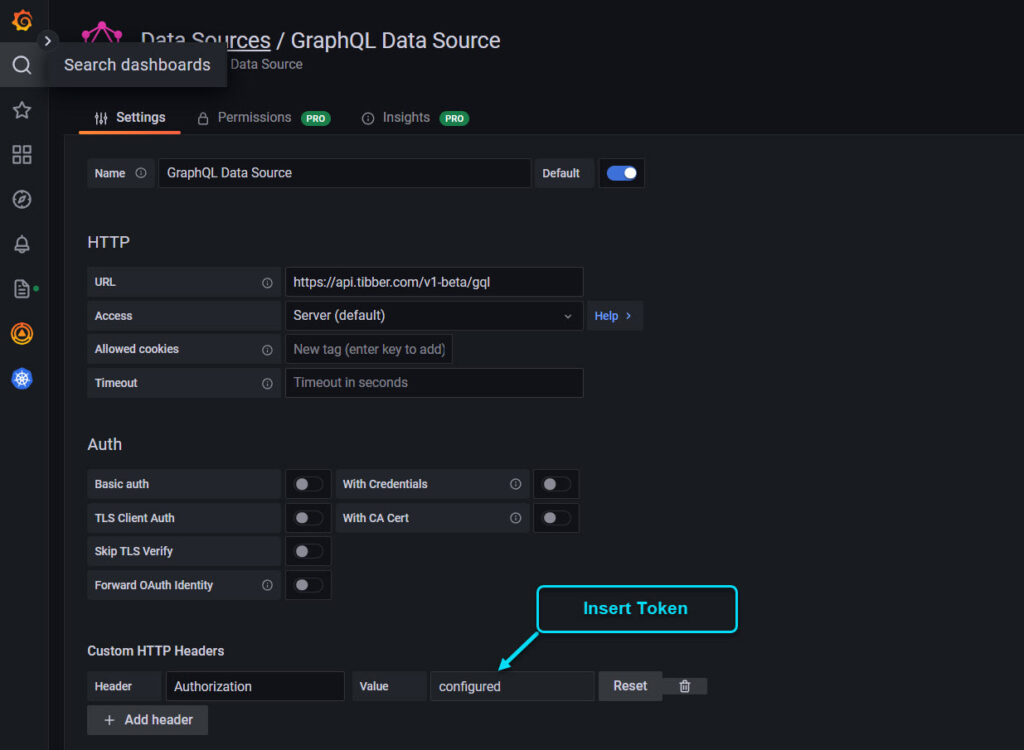
- Install new Wild GraphQL Data Source instead of GraphQL Data Source (Out of date). After installed Wild GraphQL add it as Data Source in Grafana and insert URL and custom HTTP Headers
URL: https://api.tibber.com/v1-beta/gql
Header: Authorization
Value: Bearer xxxxxxxx (Put your Token from step 1).
Demo from Tibber (Bearer 5K4MVS-OjfWhK_4yrjOlFe1F6kJXPVf7eQYggo8ebAE)
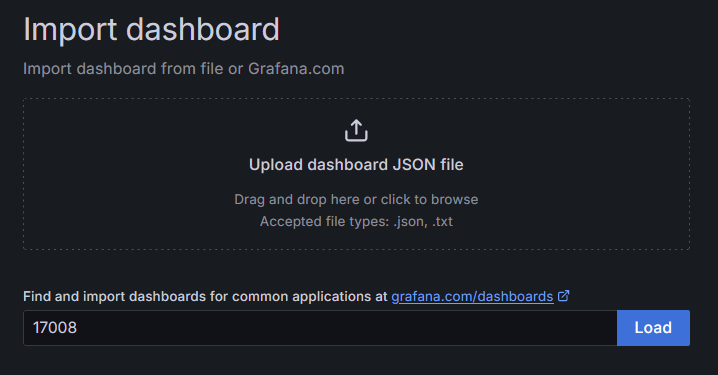
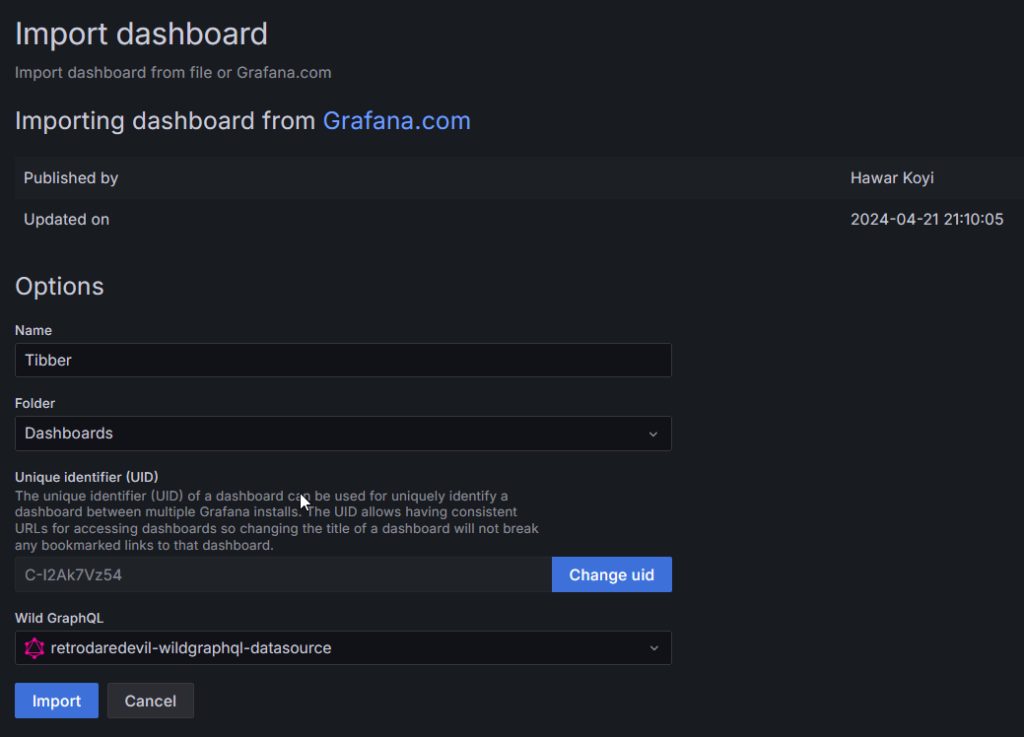
- Input my Grafana Dashboard id 17008 and import it
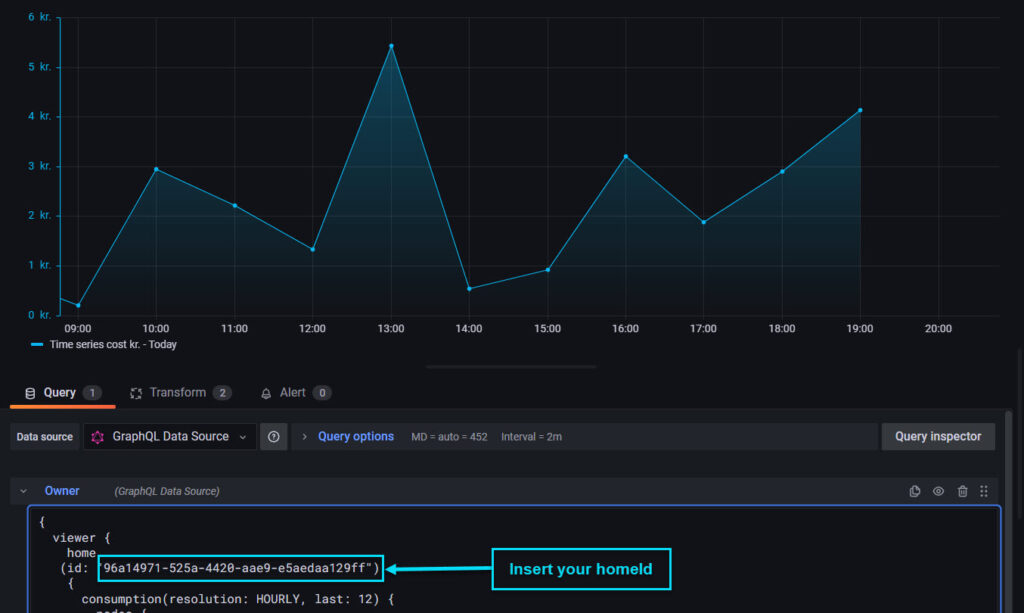
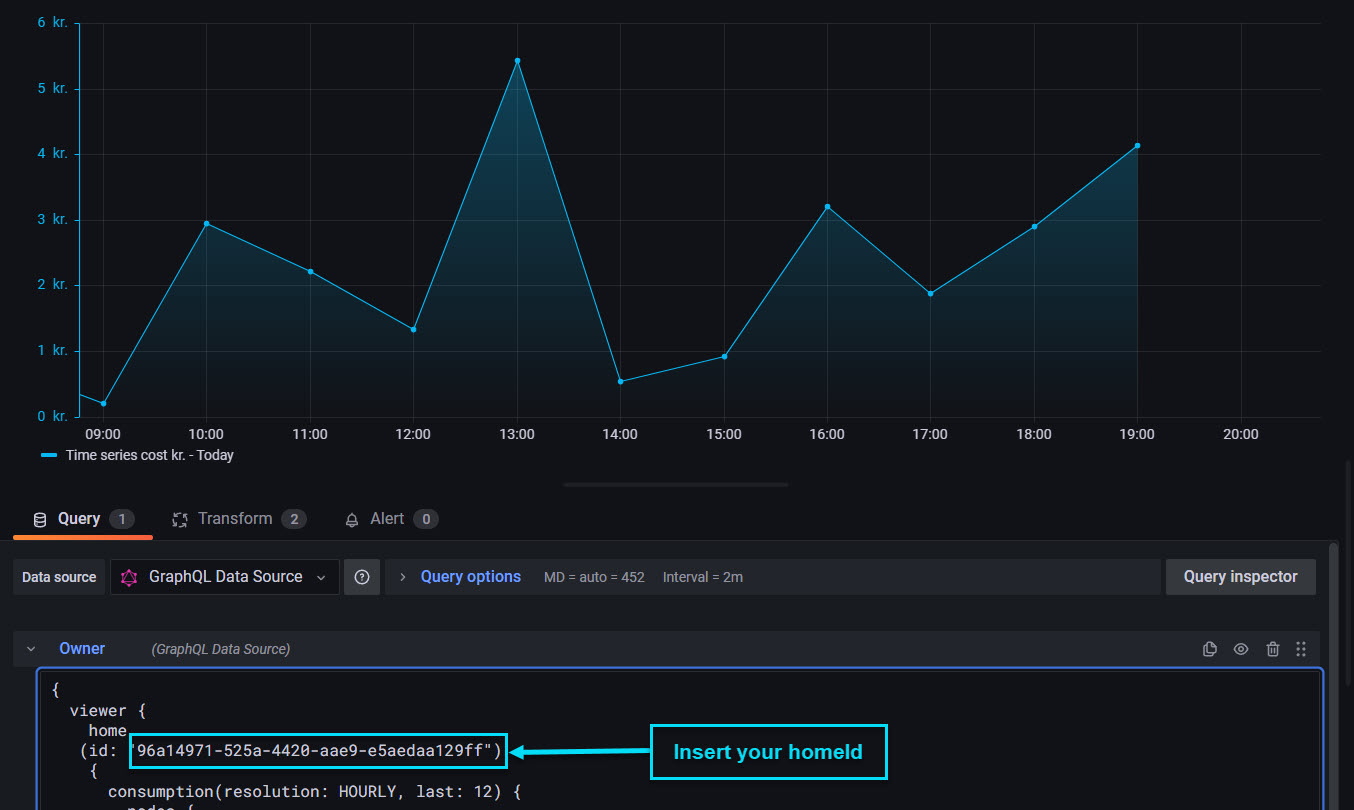
- Insert your homeId only in these to panels (Put your homeId from step 1).
Demo from Tibber: “96a14971-525a-4420-aae9-e5aedaa129ff”
Time series consumption kWh – Today and Time series cost kr. – Today
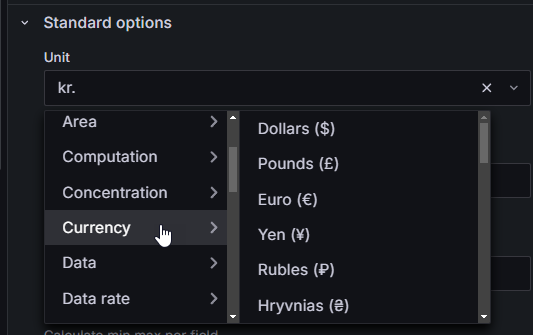
- To change currency, open the relevant panel then change it via Unit under Standard options


Additional: Watch my below video or on YouTube if you can’t figure out.
Like it if you want too Linkedin